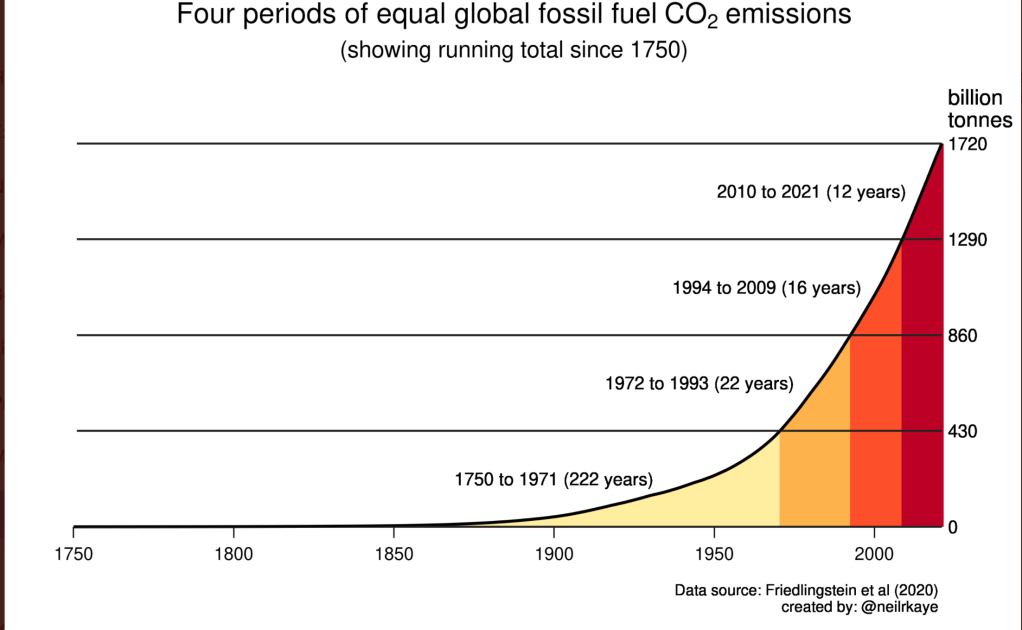
Half of emissions took place after Kyoto, a quarter in the past 10 years

This chart show emission intensity and szie per country, look how small Africa, and the width of Africa will double during this century
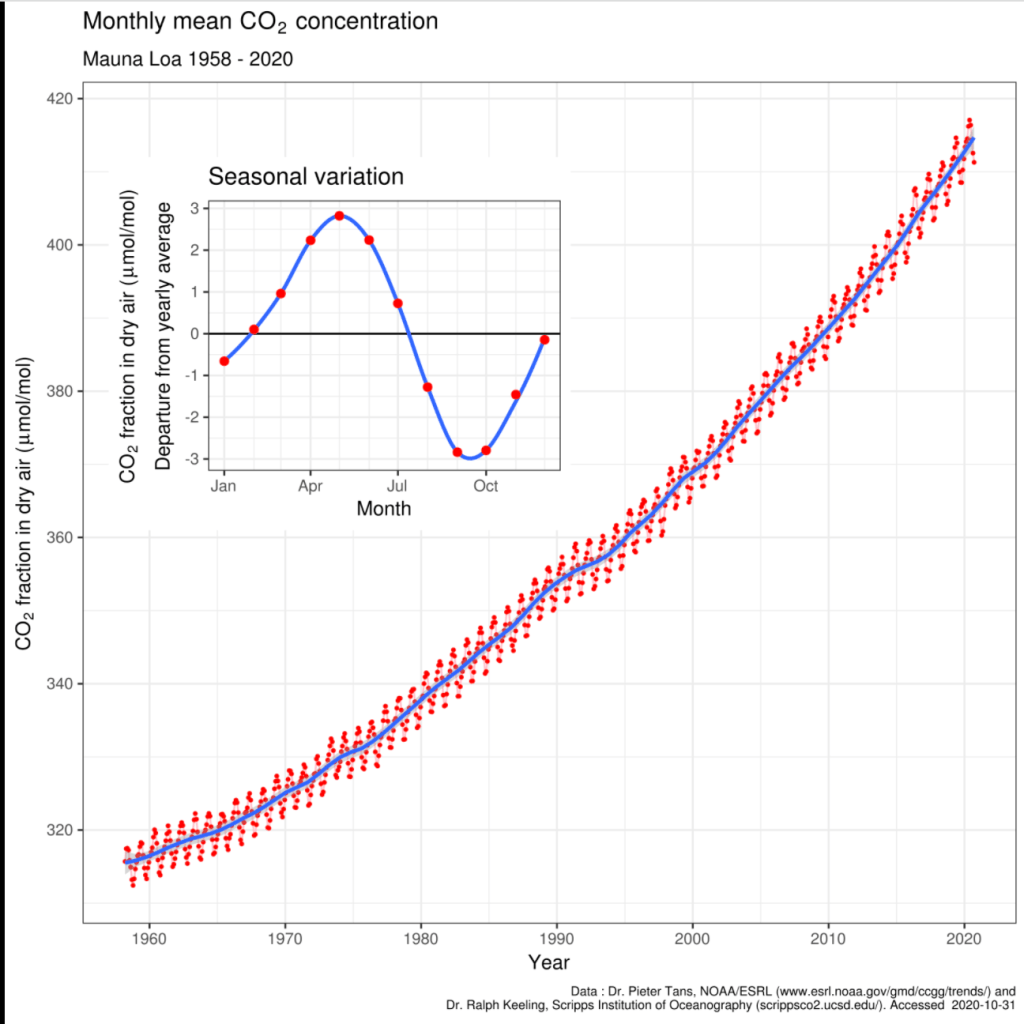
emissions are exponential, CO2 concentration in the atmosphere, exemplified by the famous Keeling curve measured at Mauna Loa, it seems linear, but really a polynomial fit wors better https://plotnick.medium.com/goodbye-400-ppm-the-statistics-of-the-keeling-curve-5a79586d1b2e
I am wondering, emissions are exponential, co2 concentration is nearly linear, how does global warming behave ? LEt’s go and look for a radiative forcing curve. Found on wikipedia, seems linear

and so is temperature grwoth vs 19th century baseline, we are at 1,07 degrees now. Which seems linear since we have been measuring co2 concentration in the atmosphere

and then we have climate, which is a complex system which might have feedbacks and tipping points.
